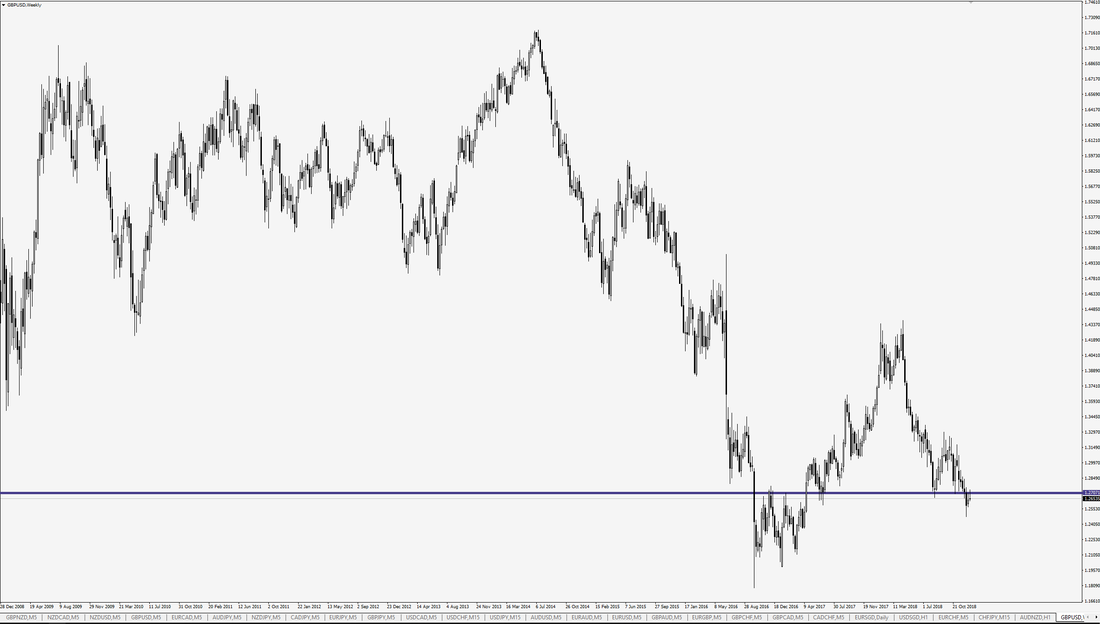
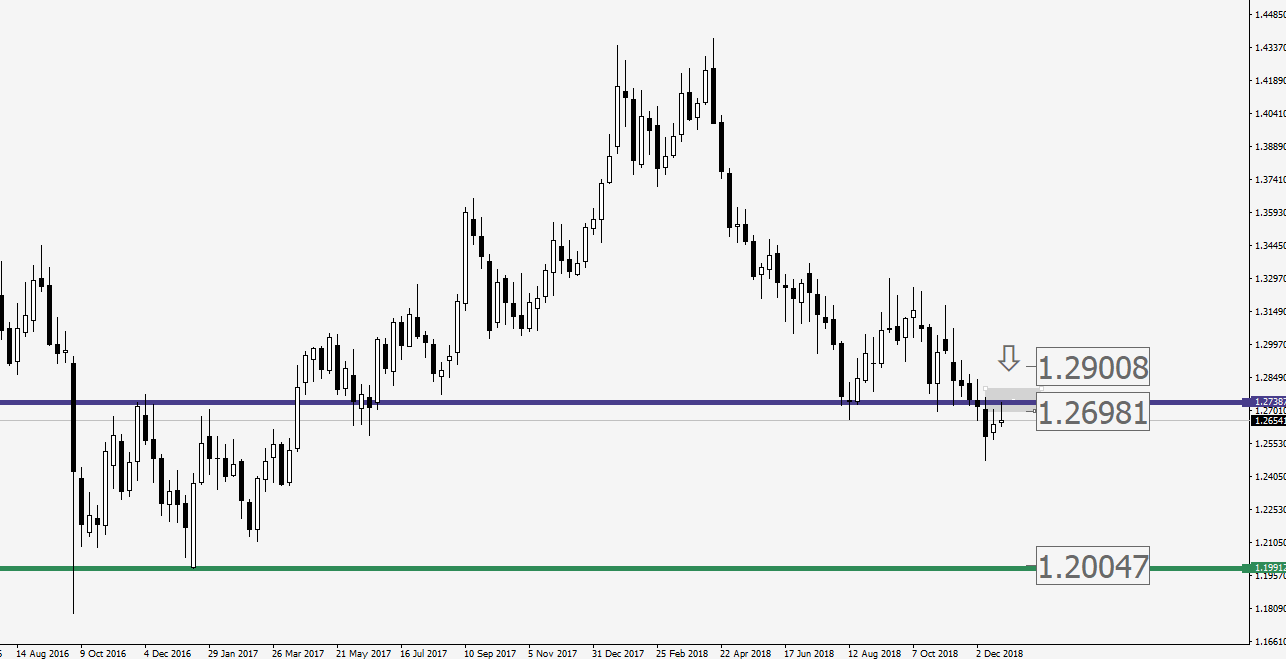
Weekly Cable GBP/USD charts 1.2738 is a perfect Zone to play a key role and perfect battle filed for Buyers and Sellers. GBP weaken last year over powerful Dollar. Probably based on price action this bearish market will continue to next major zone which is 1.20. Entry point based On PTA Discounted entry method or Fast Entry Nice Money management just above 3.17. Not perfect but worth to try.
2 Comments
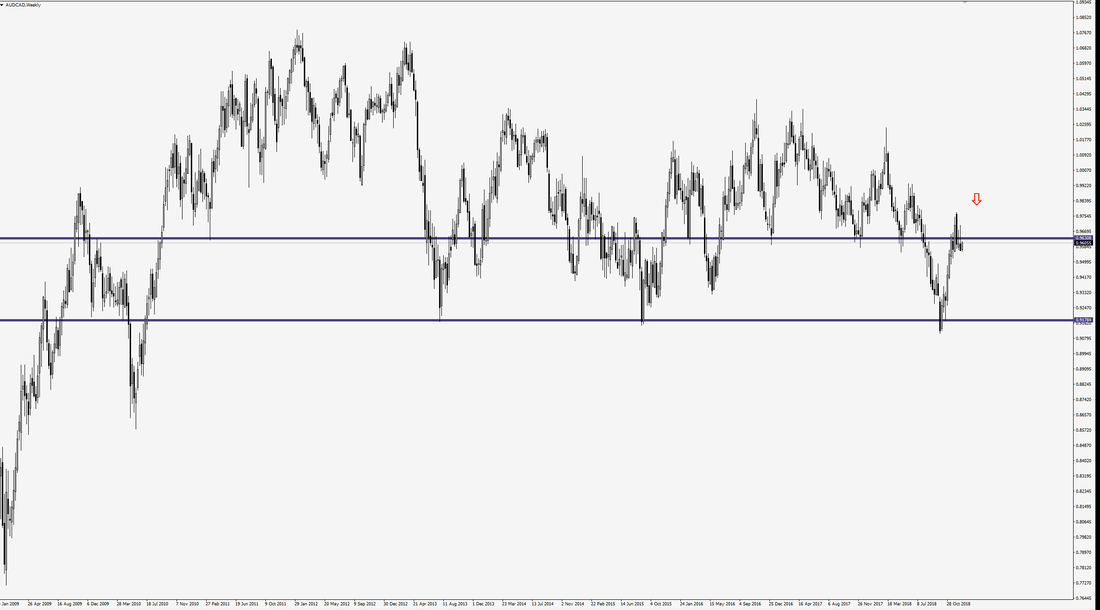
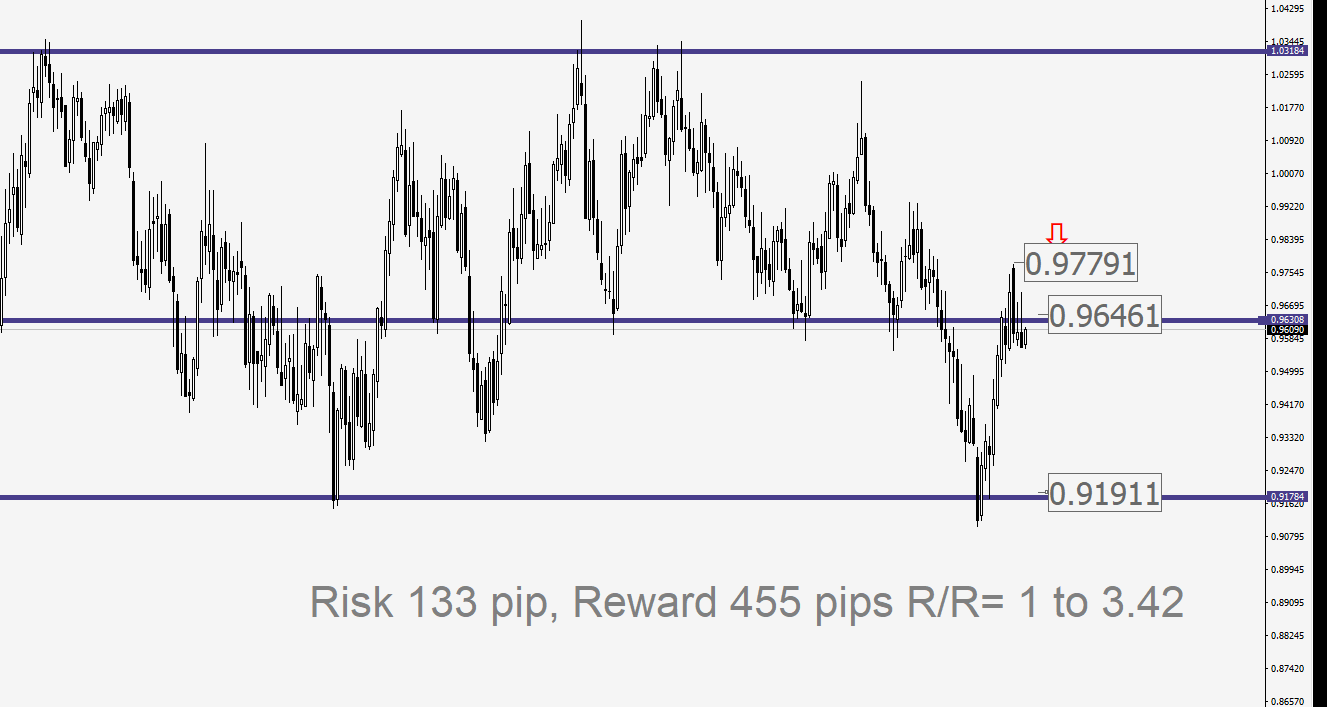
AUDCAD Weekly charts shows a huge pullback to the important Zone, we have a pretty clear sell pressure there as well. there is no doubt, price with face with big sellers and this is the battle Zone among Buyers and Sellers. we will see which one will be victory. As you can see in the chart below, the Reward to risk is more than 3 times. It means if you risk 2 present of your account you will take around 7% of your total equity. Key Important key to be successful is having a proper trade plan, having successful entry strategy, and advance money management.
Just 3 hours to FOMC Statement, I the regular FOMC meeting usually traders like us as a retail traders with the small capital compare to the big banks, prefer to stay out of market, manage open positions, and do not open new positions. But today Federal Funds Rate is add to the FOMC, Expert expect raise rate from 0.75% to 1.00%. So why we should stop trading? Firstly, as a trader keep our capital safe is the our priority. This is the first responsibility for the traders. Secondly, this is the time which big companies, Big banks, financial institutions come to play. They already set their huge volume of orders into the market. Third, In these kinda events most of the time spread increase, it means you should pay more if you wanna trade, and It doesn't make sense for retail traders. Finally, uncertainty will increased, when It comes to the forecasting, expectation, Trading come with uncertainty which is not good, because it will increase risk. We are not like Risk, traders always try to control, manage the risk, less risk is better. So for the all reasons above, close your chart, and enjoy your life by reading a great book, and sip of tea.
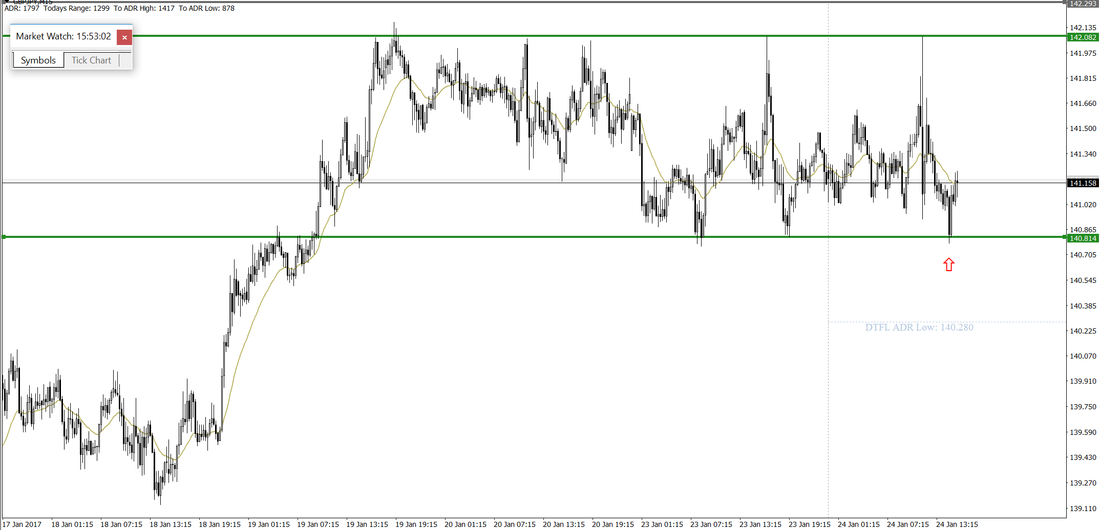
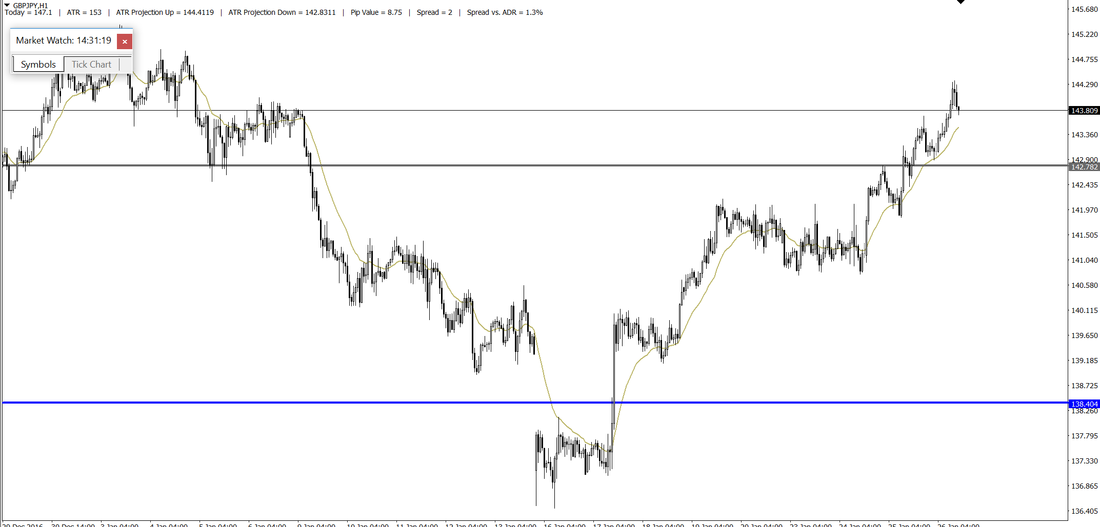
One of the best moves in the currency market happened this week on GBP/JPY. First Chart below shows the trade level for this cross very early this week, with very low risk to reward. why it that happened because I took long in the bullish market in the M15 time frame. Very classic approach to long from lower level on the consolidation area from 140.81 level. The second chart below shows the result after only 3 days in the hourly time frame. currently, price is in the 183.80. so now it is time to do the math and find the exact risk to reward ratio which is about 1 to 15. It means I risk 1% of my capital, and now gain 15% of my account, yes more than 300 pips in just 3 days.
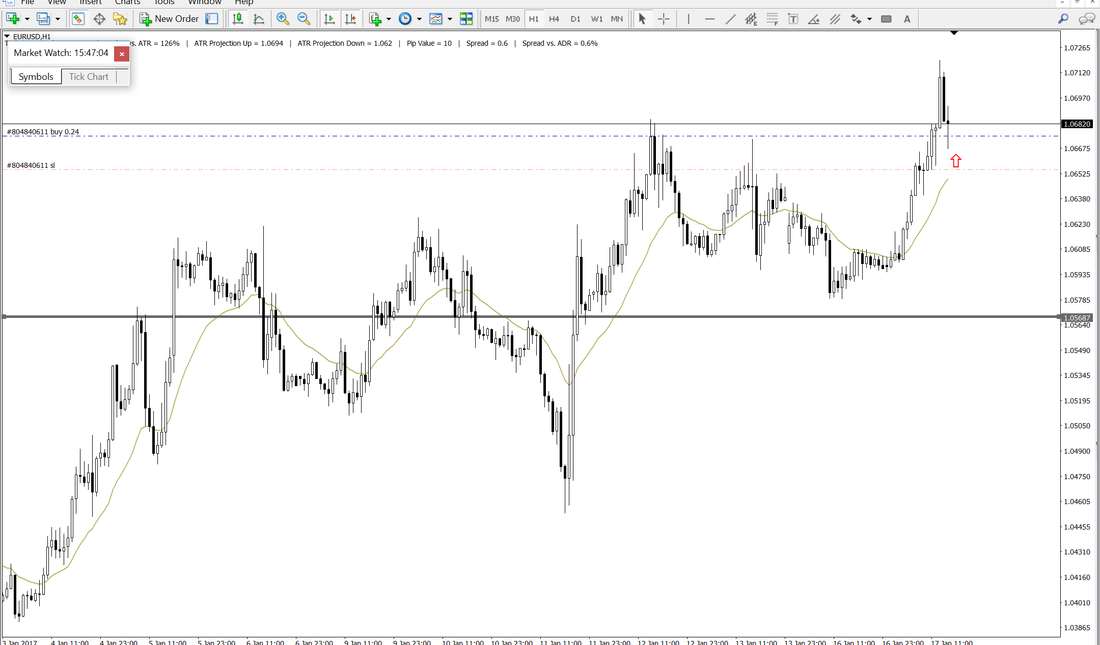
This is the recent trade by one of my student on the EUR/USD on hourly time frame. As you can see in the chart above, price broke very clean level 1.0674, then came back touch the level. You see the entry point as well as, stop loss. Take profit sat to the 1 to 2 risk to reward ratio.
You may found out the position size which is 0.24 standard lot. Well-done Bita. Short on eur/usd from the long term support which turned to short term resistance level, and also you can see price tried to reach above that zone below the down arrow, but price action shows that we have false break out and pressure to the down.
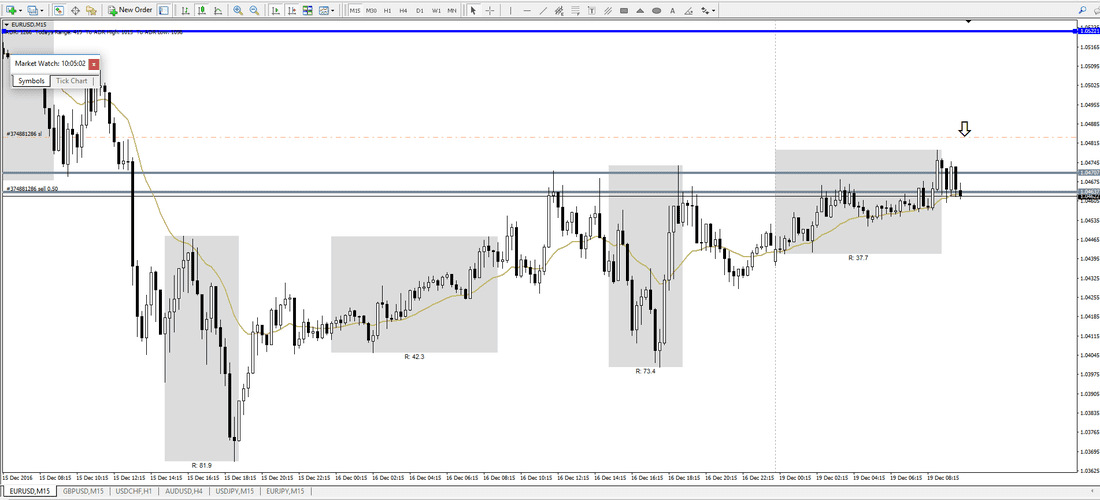
cheers Chart m15 on EURUSD shows a very clear example of False break out from the top of the range. Classic entry, and 1:2 take profit.
|
Archives
December 2018
Categories |
|
Risk Disclosure
DISCLAIMER: Futures, stocks, Forex, and options trading involves substantial risk of loss and is not suitable for every investor. The valuation of futures, stocks, Forex, and options may fluctuate, and, as a result, clients may lose more than their original investment. The impact of seasonal and geopolitical events is already factored into market prices. The highly leveraged nature of futures trading means that small market movements will have a great impact on your trading account and this can work against you, leading to large losses or can work for you, leading to large gains. You are responsible for all the risks and financial resources you use and for the chosen trading system. You should not engage in trading unless you fully understand the nature of the transactions you are entering into and the extent of your exposure to loss. If you do not fully understand these risks you must seek independent advice from your financial advisor. Copyright © 2014-2024
|

