PTA
  • PTA Forex Course
  • Live Market Analysis
    • Stock/Indices
    • Commodities
    • Forex Persian
  • دوره پیشرفته تحلیل تکنیکال
  • معرفی بروکر
  • فارسی
  • دوره بازار سهام
  • سلب مسئوليت و افشای ریسک
  • PTA Forex Course
  • Live Market Analysis
    • Stock/Indices
    • Commodities
    • Forex Persian
  • دوره پیشرفته تحلیل تکنیکال
  • معرفی بروکر
  • فارسی
  • دوره بازار سهام
  • سلب مسئوليت و افشای ریسک
Search by typing & pressing enter

YOUR CART

1/3/2019 0 Comments

FLDM

Buy Signal is around the corner on FLDM on of the cheap stocks below $10

Picture

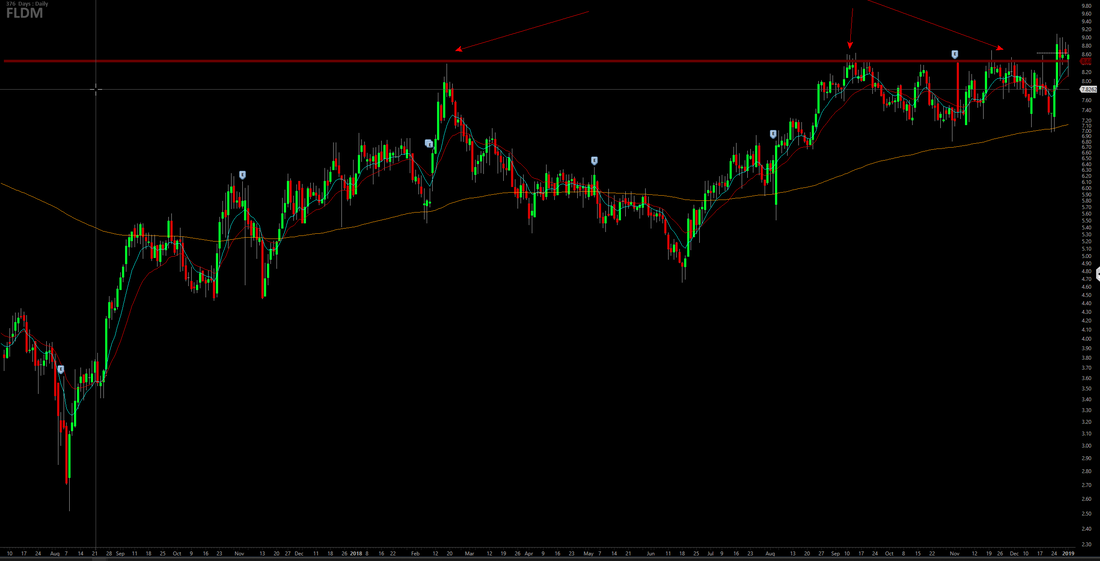
Obsessively $8.44 is one of the best zones since February 2018.

Picture

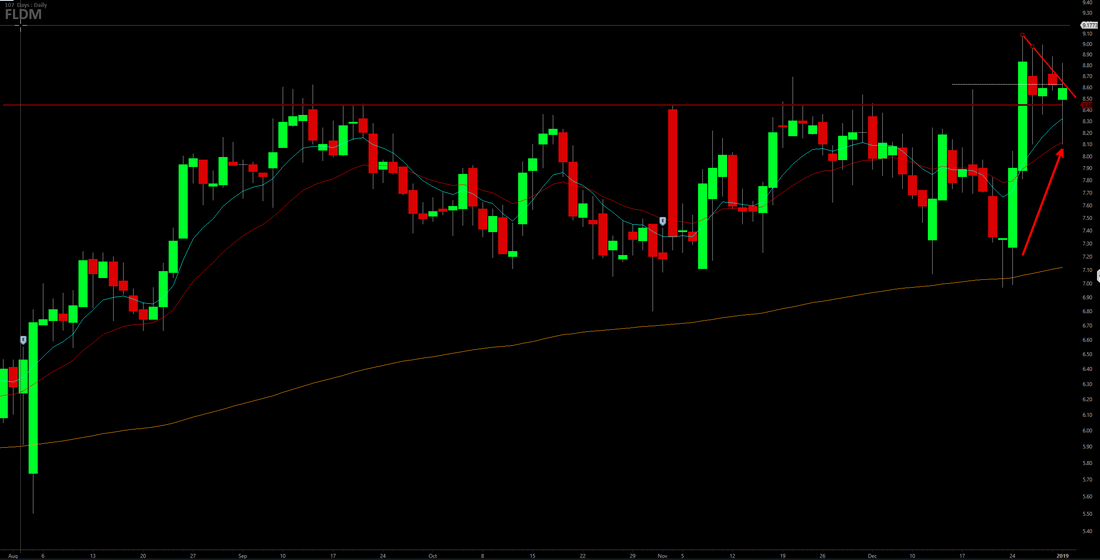
Bull flag formation on last 5 candlesticks, above Moving averages.
Entry point is around $8.50.

This is one of the best set-ups

Let`s check the financial numbers

Picture

Beta is 2.29 which is good.
YTD is 46%.

Up to you Take it or leave it

0 Comments

12/24/2018 0 Comments

SAFE

Picture
Trading is all about finding a proper chart reading techniques, plus super clear fundamentals foundation. Safety, Income & Growth Inc. (SAFE) is the first publicly traded company that focuses on acquiring, owning, managing and capitalizing ground leases. The Company seeks to provide safe, growing income and capital appreciation to shareholders by building a diversified portfolio of high quality ground leases. The Company, which is taxed as a real estate investment trust (REIT), is managed by its largest shareholder, iStar Inc. Additional information on SAFE is available on its website at www.safetyincomegrowth.com
Start first with technical analysis based on weekly and daily charts price has to pass zone 19.87. Infact finding a perfect price is not a goal. The goal is to find a proper zone to take trades based on trading plan.
Because of your broker or trading platform you will see the difference among support line in both charts. And also you can see time frames are not matter to this difference. That `s why I believe that these are a zones. Group of buyers and sellers in complex zone, yeah! Battle. It is Zone.

Picture
So let`s take look at Fundamentals
Picture
SAFE in 2017 was less share outsanding than before but now SAFE has 18.13M. Safety, Income & Growth Inc. (SAFE) announced today that the Company’s Board of Directors has declared common stock dividends of $0.15 per share for the fourth quarter of 2018. The dividend represents an annualized rate of $0.60 per share and is payable on January 15, 2019 to holders of record on December 31, 2018.
Charts looks good.
Let`s do the math:
Best entry is to break Zone, or wait for a nice first pull back. Around $20 would be Ideal but be cautions about false break out. Watch price action around there.
Buy 1000 shares on $20 target is no man land. Stop loss is $18.50. Risk is $150
Reward is at least 1:5 $600
Commission around +$4.50


To open an account and pay Zero Commission
0 Comments

4/4/2017 0 Comments

BlackBerry

Picture
 As daily BlackBerry chart shows, price is between to major daily zones, $6.41 which is the lower range level, and $8.30 which is the upper level of the range. We can have two possibilities here. First, price will continue to go up until reach the upper level then reject from that level, or Price will break the $8.30 level and continue to doing up. Second scenario is that price fails to go up and before hitting the upper level, so it will go down until reach the lower level of the range, and yes same two scenarios there again, Break-out, or false break out. This is the right example of having a proper analysis, and knowing all possibilities, and have a superior trade plan for each scenarios.
0 Comments

3/16/2017 0 Comments

JC Penney

Picture
Chart above shows, Weekly JC Penney Stock share. As chart show, weekly level 6.1600 has been holding the price since 1999. The clear weekly range, the price is going to react again from the level. This is the time to buy some retain stock share. Great risk to reward, and very good time to add some retail industry into portfolio.


0 Comments

3/13/2017 0 Comments

Amazon

Picture
 Today`s best offer is the Amazon stock. This is the very good opportunity to buy, overvalue stock like Amazon. In the chart above you can see the price broke above the previous high point ( $845 level), and pull back to it and now $845 is the best price to go long on this stock. let`s take some Amazon share here. Stop loss set at low as 1% of price share price in $835. very convenient price is n`t it? I should tell you all the stock charts and trades are in the Daily time frame, and obviously it takes weeks to see the result. In this case take profit at least sit on the %8 price move, and based on the price movement maybe change to be an open target position.
0 Comments
<<Previous

    Archives

    January 2019
    December 2018
    April 2017
    March 2017
    February 2017
    January 2017
    December 2016

    Categories

    All

Risk Disclosure
DISCLAIMER: Futures, stocks, Forex, and options trading involves substantial risk of loss and is not suitable for every investor. The valuation of futures, stocks, Forex, and options may fluctuate, and, as a result, clients may lose more than their original investment. The impact of seasonal and geopolitical events is already factored into market prices. The highly leveraged nature of futures trading means that small market movements will have a great impact on your trading account and this can work against you, leading to large losses or can work for you, leading to large gains. You are responsible for all the risks and financial resources you use and for the chosen trading system. You should not engage in trading unless you fully understand the nature of the transactions you are entering into and the extent of your exposure to loss. If you do not fully understand these risks you must seek independent advice from your financial advisor.

Copyright © 2014-2021
Reza Khantaraj
Picture