
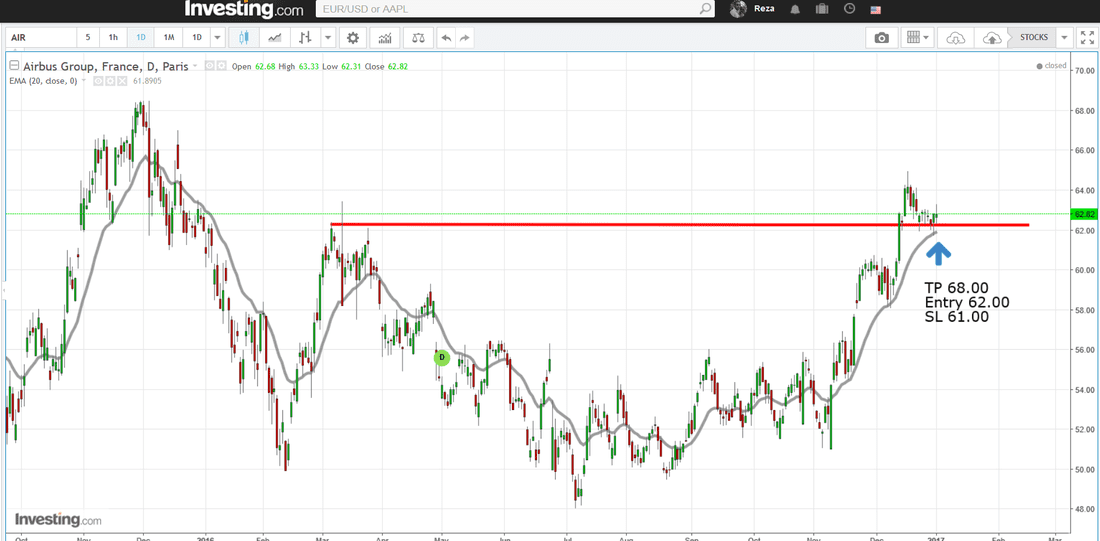
 Let`s start trading in 2017 with really perfect long position on AIrBUS Group. As you can see in the chart above in daily timeframe, Airbus has a bullish condition. As I disscuss about break-out, pull-back strategy, it is clear that price broke through the 62.00 level which is the last highest point. so very clear long position, with 1 to 8 risk to reward ratio. cheers
0 Comments
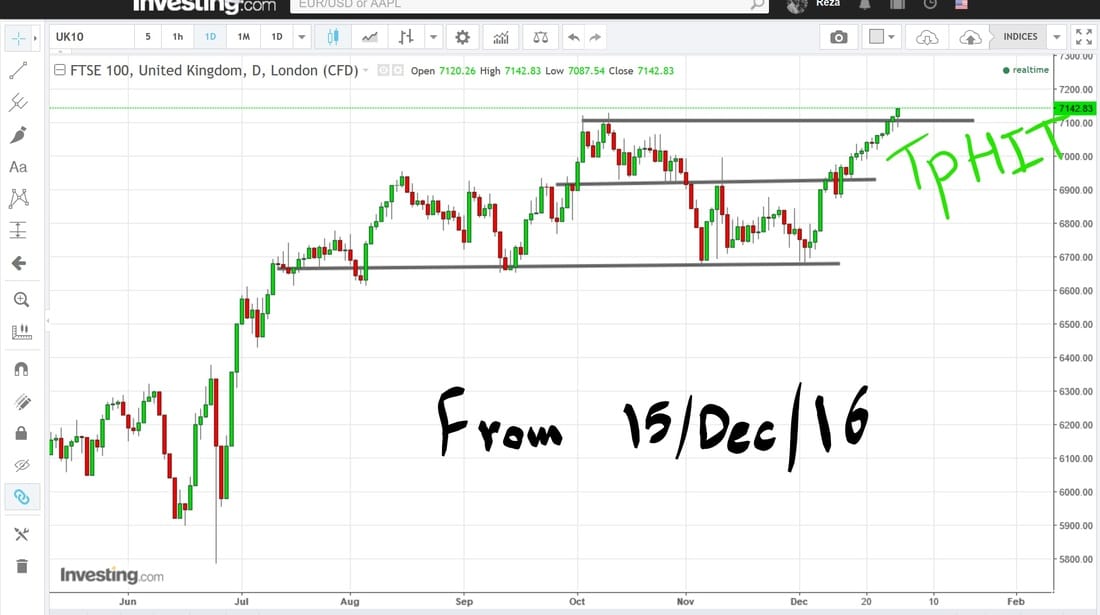 As you may read my 15 December post about FTSE100 post, there was a great opportunity to go long on FTSE. now after 15 days, not much working days, you can see in the chart above, price hit our take profit area. Very clean trade with 1 to 5 stop loss to take profit ratio. which means if you risk just only 2% of your total account, now you should have at least 10% profit. cheers
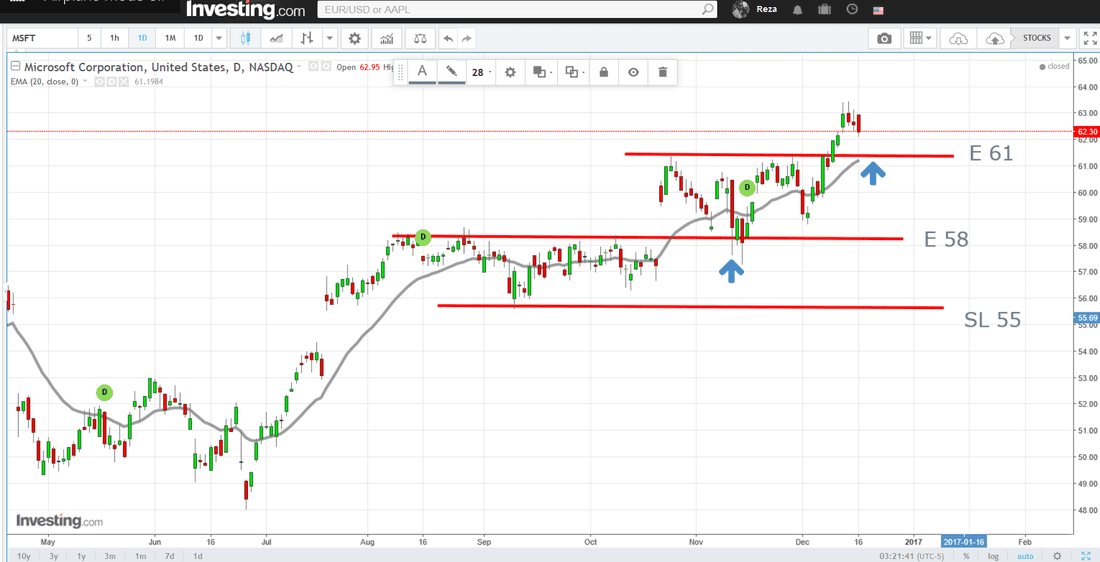 Microsoft price as you can see in the chart above still in the up trend, there where two push back to the key levels, and we`ll get the pullback after break out. Enjoy this type of trades inside the trends.
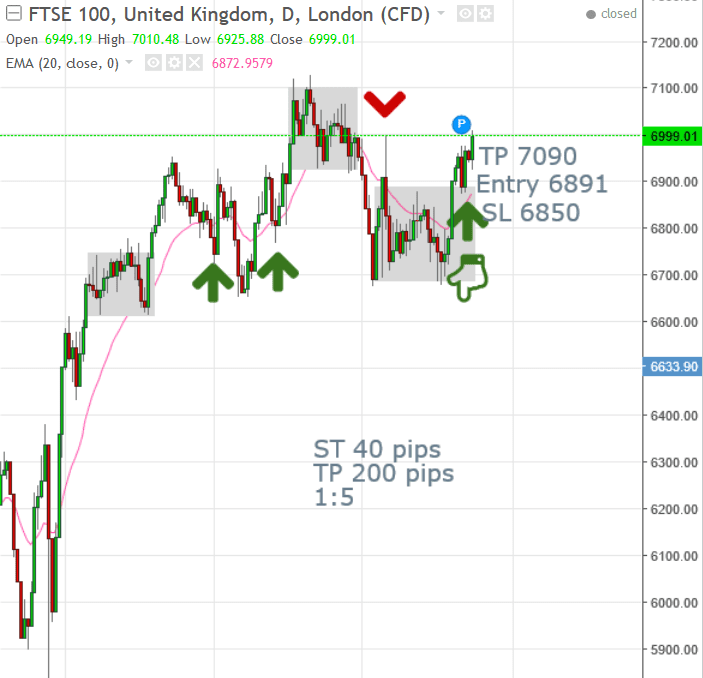
cheers Let `s start with FTSE 100 which is in uptrend and getting head up after having range bars. Entry point 6890, Stop loss 6850, and take profit 7090. with more than 1 to 5 risk to reward.
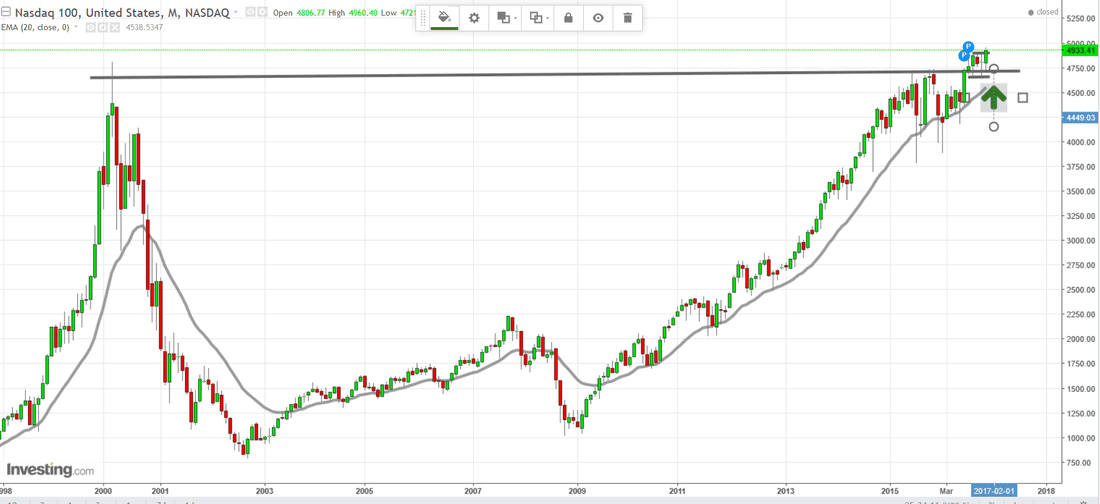
Second chart shows Nasdaq 100 in the long time frame which shows clear, and powerful uptrend at the end of year, Nasdaq 100 have been doing good after 2009. so in this time frame, entry point 4720, stop loss 4600, and open take profit position. let`s look at lower time frame on Nasdaq 100 which shows clear upward move, and now broke to the highest top of the side-way move. entry 4900, stop loss 4850, and open profit position. |

|
Risk Disclosure
DISCLAIMER: Futures, stocks, Forex, and options trading involves substantial risk of loss and is not suitable for every investor. The valuation of futures, stocks, Forex, and options may fluctuate, and, as a result, clients may lose more than their original investment. The impact of seasonal and geopolitical events is already factored into market prices. The highly leveraged nature of futures trading means that small market movements will have a great impact on your trading account and this can work against you, leading to large losses or can work for you, leading to large gains. You are responsible for all the risks and financial resources you use and for the chosen trading system. You should not engage in trading unless you fully understand the nature of the transactions you are entering into and the extent of your exposure to loss. If you do not fully understand these risks you must seek independent advice from your financial advisor. Copyright © 2014-2024
|
|